Visualizations
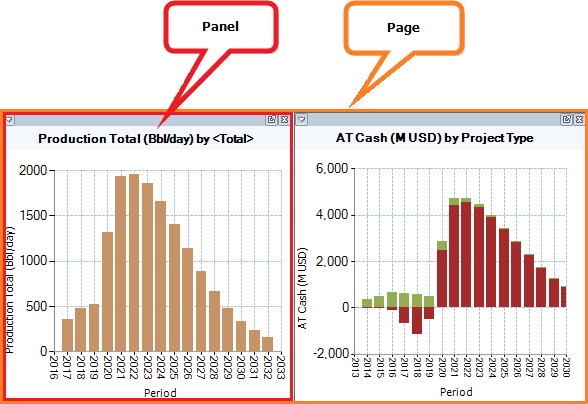
Visualizations are used to build charts, to compare portfolios to targets, and to display indicators. The Visualizations tab displays visualization pages; one page is displayed at a time. A page contains one or several visualization panels and stores all chart settings. You can create multiple pages, and use an existing page as a template to create another. For more information, see Visualization pages.

The buttons in the Visualizations tab on the ribbon are described in the table below.
| Button | Description |
|---|---|

|
Adds a new chart panel with a visualization of the type selected from the given list. |

|
Contains the following options: Copy (copies the panel for pasting into another panel or application), Copy Data (copies the data series used to draw the chart), and Copy Page (copies the current page with all panels for pasting into another page in the document). |

|
Contains the following options: Paste (pastes a copied chart into the selected panel), Paste To New Panel (pastes a copied chart into a new panel), and Paste Page (pastes a copied page with all panels). |

|
Selects the previous visualization page. |

|
Selects a visualization page. |

|
Selects the next visualization page. |

|
Creates a new page (see Add a page). |

|
Renames the current page. |

|
Deletes the current page. |

|
Opens the page management menu (see Visualization pages). |

|
Applies a template to the current page (see Apply a template to a page). |

|
Saves the current page as a template (for more information about templates, see Save a page as a template). |

|
Opens the window where you can manage templates. |
| Projects to Display | Controls the number of projects that are shown individually. If the total number of projects in a portfolio is greater than the number in this field, some projects will be grouped together as Other. If this happens then increase the number in thus field to see all of the projects individually. To change the display order of projects in a chart, open the Properties window (by right-clicking inside a chart) and use the Display Order setting on the Series tab (see Add data series). |

|
Resets the visualization panels to the default layout. |

|
Opens the Manage Filters window. |

|
Applies filters to the current page and opens the filter settings window (see Filter data). |
| Property | Select a property name for filtering. |
| Value | Select a property value for property filtering. |
Each visualization chart is contained in a separate panel. Depending on the visualization type, panels contain different menu options that are
described in sections about visualization types; to open the menu, click the 

You can display several data series on one chart. This is specified in the Properties window (see Add data series).
Initially, chart colors are assigned by default, but you can change them by using the Colors and Markers option from the chart menu (see Edit colors).
If you place the mouse pointer over an area on the chart, a tooltip with the project's name and current data point will be displayed.